Introduction
In the realm of data analysis, 'bivariates' are essential tools that help us understand the relationship between two different variables. By leveraging bivariate analysis, a new interactive dashboard is available to merge advanced mapping data with census information, which facilitates the exploration of how services are distributed and accessed across different regions.
Demystifying Bivariates
- Bivariate Analysis: This is a form of statistical analysis that investigates the relationship between two data sets.
- Relevance: Understanding bivariate relationships is crucial for identifying patterns, trends, and potential correlations between different factors and population characteristics.
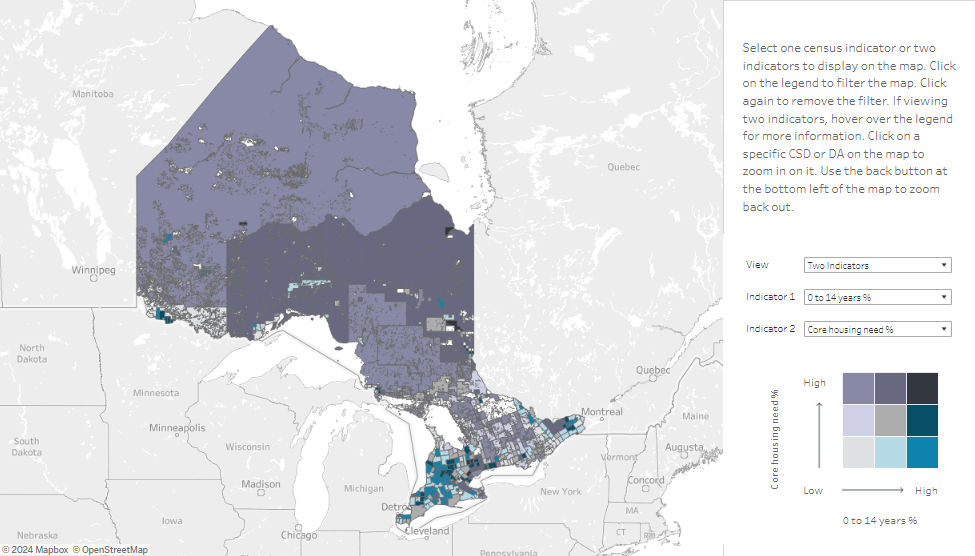
The Dashboard's Role in Bivariate Analysis
- Service Access Visualization: This feature employs bivariate analysis to display how different services are geographically distributed and accessed. Note: This visualization indicates correlations but does not imply causality.
Exploratory Data: Users can interact with the data to explore current states and delve into the alignment between service demand and supply. Caution: Correlations observed here should not be interpreted as causal relationships.
Why Bivariates Matter to You
- Decision Making: For organizations and individuals, bivariate analysis provides insights that are pivotal in strategic planning and resource allocation. It allows stakeholders to make informed decisions by understanding the relationship between two variables.
Identifying Needs: It highlights areas with inadequate service coverage, helping to target interventions where they are most needed. For instance, bivariate analysis can be used to pinpoint the optimal location for a new service facility or to identify neighborhoods at the highest risk of specific adverse events.
Strategic Placement and Risk Assessment: Bivariate analysis is particularly useful for spatial decision-making. By analyzing two related geographic data points, such as population density and crime rate, organizations can determine where to best place services or identify which neighborhoods are more vulnerable and require immediate attention.
Key Features of the Dashboard
- Data Sources: Integrates diverse datasets such as social service programs, matrices, and census boundaries.
- Proximity Measure Computational Model: Adopts a sophisticated model to gauge service accessibility, enhancing the understanding of service demand versus supply.
Conclusion
Bivariate analysis is more than a technical term; it's a lens through which we can view the complex interplay between different societal elements. By implementing this analysis in an interactive dashboard, decision-makers can make more informed decisions, ensuring that services are efficiently allocated and accessible to those in need.